

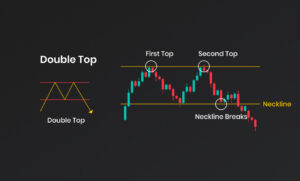
Double Top
Double top is a popular chart pattern which is used to identify potential trend reversal. It is identified when the price of an asset shows two consecutive peaks at the same or similar level. This pattern is considered to be a sign of bearish reversal, as the asset’s price fails to break above the previous peak. The double top chart pattern is made up of two peaks with a valley in between. The peaks signify a resistance level, meaning that the asset’s price struggles to break through it. The valley between the two peaks is called the “neckline”, and when the price of the instrument breaks below this neckline, it is seen as a signal of the reversal pattern. The double top formation is generally preceded by an uptrend, and it marks the point of exhaustion of the asset’s buyers. As the buyers are unable to push the price higher, sellers will take control of the trend and push the asset’s price lower.
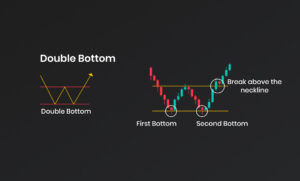
Double Bottom
Double bottom is a technical chart pattern used by traders to predict a bullish reversal in the instrument’s price action. The pattern is composed of two consecutive troughs that form a “W” shape on the chart. The first trough marks the bottom of the instrument’s previous trend, while the second trough marks the bottom of the new trend. In between the two troughs lies a peak, which marks an uptrend that is likely to follow. The double bottom pattern is identified by traders when the instrument’s price action reaches the second trough and begins to rally. It is considered an indication of strength when the security’s price breaks out of the pattern to the upside.