Bearish/Bullish Rectangle
Certainly! The Bearish and Bullish Rectangle are chart patterns used in technical analysis to identify potential trend continuation setups. They are characterized by horizontal trendlines that form a rectangular shape on the price chart.
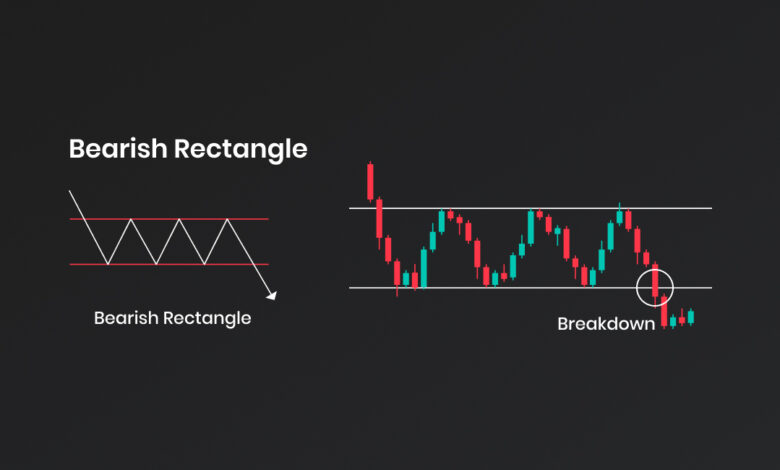

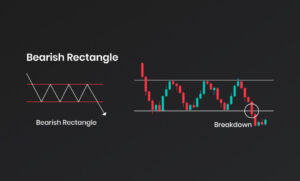
1-Bearish Rectangle
A bearish rectangle chart pattern is a trading pattern that occurs on a chart, when prices move within a rectangular top and bottom range. This range is formed by two parallel, horizontal trend lines that act as support and resistance, respectively. After a period of consolidation, the price breaks out of the pattern in a downward direction, signaling that a continuation of the existing bearish trend is likely. The bearish rectangle chart pattern is considered a reliable signal of a bearish price trend and is often used by technical traders to make trading decisions.
The Bearish Rectangle pattern is a continuation pattern that occurs during a downtrend. It indicates a period of consolidation and suggests that sellers are temporarily pausing before resuming their downward pressure on the price.
Formation:
– Prior Downtrend: The Bearish Rectangle pattern forms after a sustained downtrend, indicating a pause in selling pressure.
– Horizontal Trendlines: The pattern is defined by two parallel horizontal trendlines. The upper trendline acts as resistance, preventing the price from rising significantly, while the lower trendline acts as support, preventing the price from declining further.
– Consolidation: The price oscillates between the support and resistance levels, forming a rectangle shape. This indicates a period of indecision and balance between buyers and sellers.
Breakdown Confirmation:
– Bearish Breakdown: The Bearish Rectangle pattern is considered complete when the price breaks below the lower trendline, confirming the continuation of the downtrend. This breakdown is often accompanied by an increase in trading volume, validating the bearish move. Traders interpret this as a bearish signal to enter or maintain short positions.
Target:
– Price Projection: To estimate the potential price target after a breakdown, traders often measure the height of the rectangle pattern (from the resistance to the support level) and project it downward from the breakdown point. This projection provides an approximate target for the continuation of the downtrend.
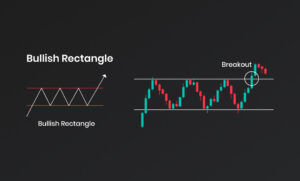
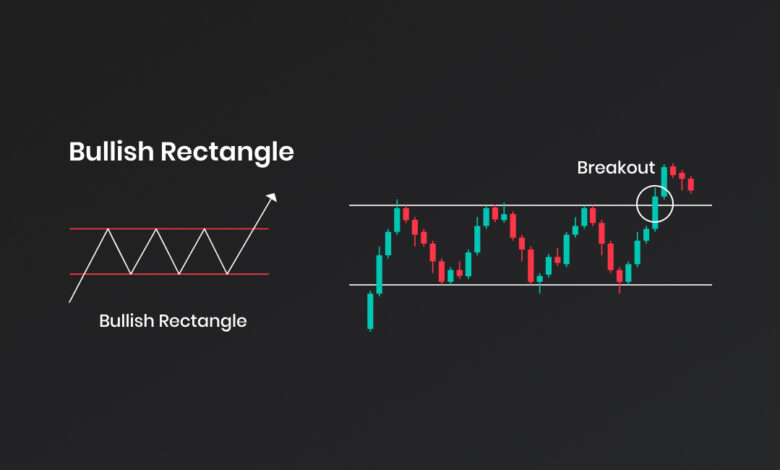
2-Bullish Rectangle
A bullish rectangle chart pattern is a type of technical analysis pattern that signals a potential trend continuation and serves as a great trading opportunity. It is formed when price movements create two horizontal lines which intersect at two opposite ends, creating a “rectangle” shape. The price action appears to “consolidate” within the rectangle area and typically breaks out of this area in the direction of the ‘bullish’ sentiment. A bullish rectangle chart pattern is typically seen as a sign of strength and a likely indication that the trend is set to move upwards. To confirm a breakout, the price should close above the upper resistance line of the rectangle chart pattern. In short, a bullish rectangle chart pattern is an indication of an uptrend and can be used to spot potential trading opportunities.
The Bullish Rectangle pattern is a continuation pattern that occurs during an uptrend. It suggests a temporary pause in buying pressure before the price resumes its upward movement.
Formation:
– Prior Uptrend: The Bullish Rectangle pattern forms after a sustained uptrend, indicating a temporary consolidation phase.
– Horizontal Trendlines: The pattern is defined by two parallel horizontal trendlines. The lower trendline acts as support, preventing the price from declining significantly, while the upper trendline acts as resistance, preventing the price from rising further.
– Consolidation: The price moves within the range bounded by the support and resistance levels, forming a rectangle shape. This indicates a period of indecision and balance between buyers and sellers.
Breakout Confirmation:
– Bullish Breakout: The Bullish Rectangle pattern is considered complete when the price breaks above the upper trendline, confirming the continuation of the uptrend. This breakout is often accompanied by an increase in trading volume, validating the bullish move. Traders interpret this as a bullish signal to enter or maintain long positions.
Target:
– Price Projection: To estimate the potential price target after a breakout, traders often measure the height of the rectangle pattern (from the support to the resistance level) and project it upward from the breakout point. This projection provides an approximate target for the continuation of the uptrend.
It’s important to note that not all Rectangle patterns result in significant breakouts or breakdowns. Traders often use additional technical indicators or price confirmation to validate breakouts before making trading decisions. Furthermore, Rectangle patterns can occur on various timeframes and in different markets, allowing traders to apply them in their preferred trading instruments.