Trading Strategies
-
Aug- 2023 -11 AugustTrading Forex0 1,417
Symmetrical triangle and Rising wedge
Symmetrical triangle A common chart pattern observed in technical analysis is a symmetrical triangle. It occurs when an asset’s price…
Read More » -
11 August
 Trading Forex0 5,386
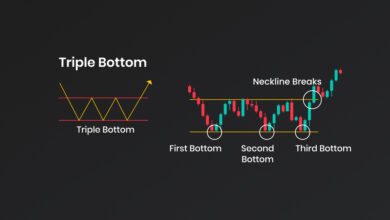
Triple Top/Bottom
Triple Top The triple top chart pattern is a technical analysis charting pattern used to identify potential reversal in an…
Read More » -
11 August
 Trading Forex0 1,888
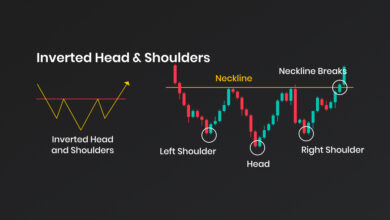
Head & Shoulders and Inverted Head & Shoulders
Head & Shoulders The head and shoulders chart pattern is a technical indicator that depicts a price decline and subsequent…
Read More » -
11 August
 Trading Forex0 2,568
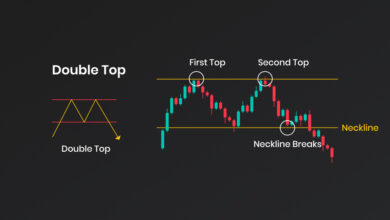
Double Top/Bottom
Double Top Double top is a popular chart pattern which is used to identify potential trend reversal. It is identified…
Read More » -
11 AugustTrading Forex0 4,448
Bearish/Bullish Flag
Bearish A bearish flag chart pattern is a technical analysis term used to describe a price formation that is typically…
Read More » -
11 AugustTrading Forex0 3,323
Bearish/Bullish double pennant
Bearish A bearish pennant chart pattern is a technical analysis indicator that typically forms after a sharp price decline, followed…
Read More » -
11 AugustTrading Forex0 2,724
Cup & Handle / Inverted Cup & Handle
Cup & Handle It is a chart pattern that looks like a cup with a handle and is used to…
Read More » -
11 August
 Trading Forex0 1,569
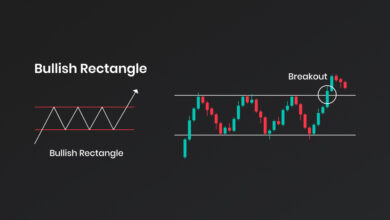
Bearish/Bullish Rectangle
1-Bearish Rectangle A bearish rectangle chart pattern is a trading pattern that occurs on a chart, when prices move within…
Read More » -
11 AugustTrading Forex0 2,850
Falling wedge
Falling wedge A falling wedge chart pattern is a technical analysis indicator used in trading to identify potential entry signal.…
Read More »
