
Bearish A bearish flag chart pattern is a technical analysis term used to describe a price formation that is typically…
Read More »Continuation Patterns
Continuation chart patterns are technical indicators used in trading that can provide clues about the direction of the asset’s price. They provide a way to determine when an asset’s current trend is likely to continue. These patterns are formed on charts, usually through a series of candles or bars, and can be used to recognize potential buy or sell signals. Common examples of continuation chart patterns include rectangles, triangles, flags, and pennants, as well as cup and handle patterns. These patterns are important to consider when trading, as they can help traders identify potential buy and sell signals in the market.
Bearish A bearish pennant chart pattern is a technical analysis indicator that typically forms after a sharp price decline, followed…
Read More »Cup & Handle It is a chart pattern that looks like a cup with a handle and is used to…
Read More »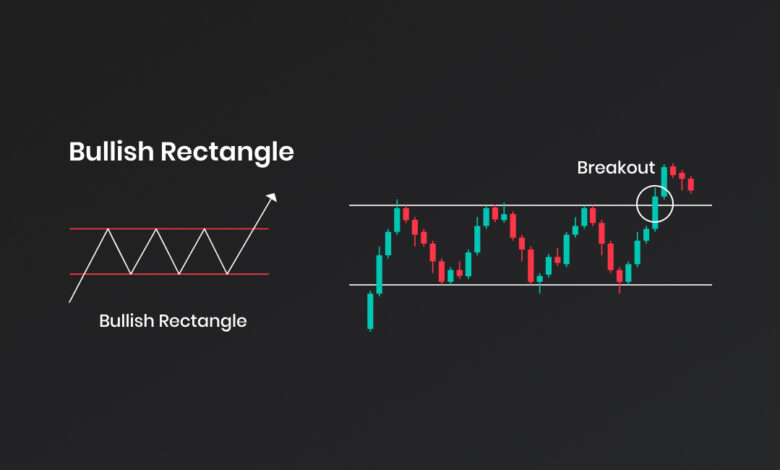
1-Bearish Rectangle A bearish rectangle chart pattern is a trading pattern that occurs on a chart, when prices move within…
Read More »