
Reversal Chart Patterns
Reversal chart patterns are technical indicators that traders use to identify potential buying and selling opportunities in the markets. Reversal chart patterns are created by the movement of price and the corresponding trading volume to identify changes in the current trend. Some of the most common reversal chart patterns include head and shoulders, double and triple tops/bottoms. Each of these patterns has a unique shape and provides a potential trade opportunity when the price breaks out from the pattern. It is important to note that these patterns alone should not be used as definite indicators for an entry and should be considered as part of the technical analysis.
-
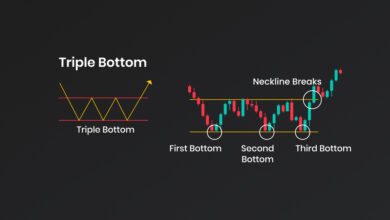
Triple Top/Bottom
Triple Top The triple top chart pattern is a technical analysis charting pattern used to identify potential reversal in an…
Read More » -
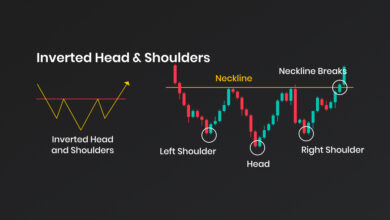
Head & Shoulders and Inverted Head & Shoulders
Head & Shoulders The head and shoulders chart pattern is a technical indicator that depicts a price decline and subsequent…
Read More » -
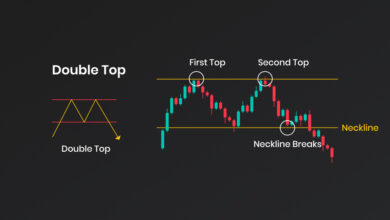
Double Top/Bottom
Double Top Double top is a popular chart pattern which is used to identify potential trend reversal. It is identified…
Read More »