Forex Price Charts Basics
Forex Price Charts Basics: A Comprehensive Guide
Introduction:
Forex price charts play a crucial role in understanding and analyzing the foreign exchange market. These charts provide valuable insights into past price movements and help traders make informed decisions. In this article, we will explore the basics of forex price charts, including different chart types, timeframes, key elements, and the importance of chart analysis in forex trading.
Understanding Forex Price Charts:
Forex price charts visually represent the historical price movements of currency pairs over a specific time period. Traders use these charts to identify patterns, trends, support and resistance levels, and other technical indicators that can guide their trading strategies. The two primary types of price charts used in forex trading are line charts and candlestick charts.
1. Line Charts:
Line charts are the simplest form of forex price charts. They connect the closing prices of currency pairs over a specified period of time, creating a continuous line. Line charts provide a basic overview of price movements but lack detailed information about highs, lows, and opening prices. They are commonly used for long-term analysis and to identify overall trends.
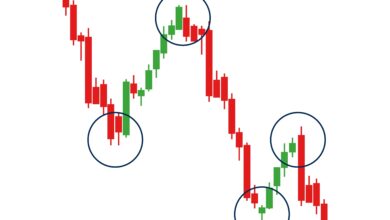
2. Candlestick Charts:
Candlestick charts are the most popular type of forex price charts due to their comprehensive representation of price movements. Each candlestick on the chart represents a specific time period, such as one minute, one hour, one day, or longer. Candlesticks display four key price points: the opening price, closing price, high price, and low price.
– Bullish Candlesticks: A bullish (or green) candlestick indicates that the closing price is higher than the opening price. It represents positive market sentiment and potential buying pressure.
– Bearish Candlesticks: A bearish (or red) candlestick indicates that the closing price is lower than the opening price. It represents negative market sentiment and potential selling pressure.
Candlestick charts provide valuable information about price volatility, market sentiment, and potential reversals. Traders often use candlestick patterns and combinations to identify trend reversals, support and resistance levels, and entry or exit points.
Timeframes in Forex Price Charts:
Forex price charts offer various timeframes, allowing traders to analyze price movements over different intervals. Commonly used timeframes include:
1. Short-Term Timeframes: These timeframes range from one minute to one hour and are suitable for day traders or scalpers aiming to capture short-term price fluctuations.
2. Medium-Term Timeframes: Timeframes between four hours and one day are often used by swing traders looking to profit from medium-term trends and price reversals.
3. Long-Term Timeframes: Timeframes ranging from one week to one month or more are suitable for long-term investors and position traders who seek to capitalize on major market trends.
Key Elements of Forex Price Charts:
When analyzing forex price charts, traders should consider the following key elements:
1. Trend Lines: Trend lines are diagonal lines drawn on the chart to connect a series of higher lows (in an uptrend) or lower highs (in a downtrend). Trend lines help identify the direction of the market and potential support and resistance levels.
2. Support and Resistance Levels: Support levels are price levels where buying pressure is expected to outweigh selling pressure, causing the price to bounce back up. Resistance levels, on the other hand, are price levels where selling pressure is expected to outweigh buying pressure, causing the price to reverse or consolidate.
3. Technical Indicators: Forex price charts are often accompanied by technical indicators, such as moving averages, oscillators, or volume indicators. These tools provide additional insights into market conditions, momentum, and potential entry or exit signals.
The Importance of Chart Analysis in Forex Trading:
Chart analysis is a fundamental aspect of forex trading as it helps traders make informed decisions based on historical price patterns and market trends. By analyzing forex price charts, traders can:
– Identify trends and reversals: Price charts help identify the direction of the market, potential trend reversals, and entry or exit points.
– Determine support and resistance levels: Price charts highlight key price levels where the market is likely to react, providing opportunities for traders to plan their trades and manage risk.
– Apply technical indicators: By combining chart analysis with technical indicators, traders gain a comprehensive understanding of market conditions and potential trading opportunities.
Conclusion:
Forex price charts are essential tools for understanding and analyzing the foreign exchange market. Line charts and candlestick charts provide valuable insights into past price movements and help traders make informed decisions. By understanding different chart types, timeframes, key elements, and the importance of chart analysis, traders can effectively interpret price patterns, identify trends, and determine potential entry or exit points. Incorporating chart analysis into forex trading strategies enhances the decision-making process and improves the overall trading performance.