Head & Shoulders

Head & Shoulders
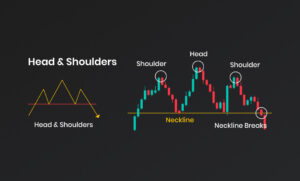
The head and shoulders chart pattern is a technical indicator that depicts a price decline and subsequent reversal. The pattern consists of three peaks—two smaller peaks on either side of a larger peak in the middle. The peaks are called “shoulders” and the middle peak is called the “head.” The neckline is a line drawn along the valleys that connect the shoulders and head. When the price falls below the neckline, it indicates a potential reversal in the trend. Traders use the head and shoulders pattern to identify potential entry and exit points in the market.
1. Formation of the Pattern:
The Head and Shoulders pattern consists of three successive peaks, with the middle peak (the “head”) being the highest, and the two outer peaks (the “shoulders”) being lower but relatively equal in height. The pattern is formed by a combination of upward and downward price movements.
Key Elements of the Pattern:
– Left Shoulder: The first peak (left shoulder) forms during the uptrend. It represents a temporary high point where buyers start losing momentum, leading to a minor pullback.
– Head: The second peak (head) is the highest point in the pattern. It signifies the final attempt of buyers to push the price higher. However, the selling pressure becomes stronger, resulting in a more significant pullback.
– Right Shoulder: The third peak (right shoulder) forms at a similar level to the left shoulder. It represents another failed attempt by buyers to sustain the uptrend. The price then undergoes a pullback, forming a support level near the previous troughs.
2. Neckline:
The Neckline is a trendline that connects the low points of the pullbacks between the peaks of the pattern. It acts as a support level and plays a crucial role in confirming the pattern.
3. Confirmation of the Pattern:
The Head and Shoulders pattern is considered complete when the price breaks below the Neckline. This breakdown should be accompanied by an increase in trading volume, indicating a potential trend reversal.
– Bearish Reversal: The breakdown below the Neckline suggests that selling pressure has overwhelmed buying pressure, indicating a shift from an uptrend to a downtrend. Traders often interpret this as a bearish signal to enter short positions or exit long positions.
4. Target:
To estimate the potential price target after the breakdown, traders commonly use the pattern’s height. They measure the distance from the top of the Head to the Neckline and project it downward from the Neckline. This projection provides an approximate target for the potential downward move.
It’s important to note that not all Head and Shoulders patterns result in significant reversals, and false signals can occur. Traders often use additional technical indicators or price confirmation to validate the pattern before making trading decisions. Additionally, variations of the Head and Shoulders pattern, such as inverted or complex versions, can also occur, and traders adapt their analysis accordingly.
The Head and Shoulders pattern can be applied to different timeframes and traded in various markets. Traders often combine it with other technical analysis tools and indicators to increase the probability of successful trades.
Inverted Head & Shoulders
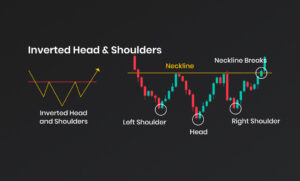
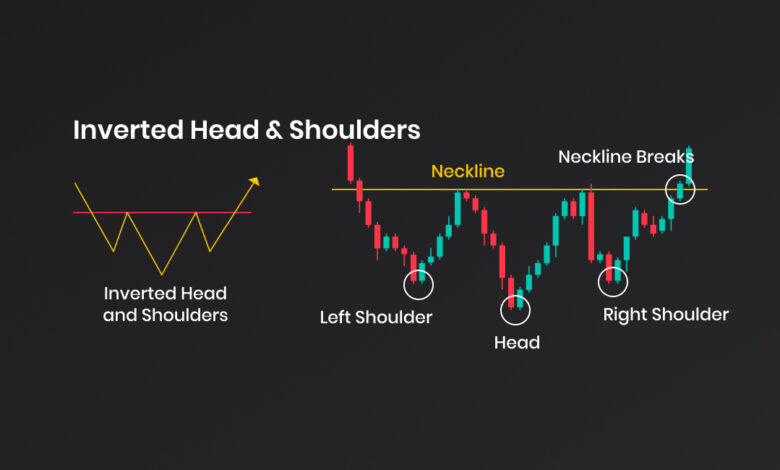
An inverted head and shoulders chart pattern is one of the common chart patterns found in technical analysis. It is generally considered a reversal pattern that typically signals an upcoming bullish trend after a period of a bearish trend or a period of consolidation. The pattern is formed by three successive price bottoms, with the middle bottom (head) being the lowest, and the two other bottoms (shoulders) being higher on both sides. The pattern is completed when the price crosses above the neckline, which is formed by connecting the high points of the two shoulders. This indicates that the bearish trend has reversed and the price is likely to continue its upward move.
1. Formation of the Pattern:
The Inverted Head and Shoulders pattern consists of three successive troughs, with the middle trough (the “head”) being the lowest, and the two outer troughs (the “shoulders”) being higher but relatively equal in depth. The pattern is formed by a combination of downward and upward price movements.
Key Elements of the Pattern:
– Left Shoulder: The first trough (left shoulder) forms during the downtrend. It represents a temporary low point where sellers start losing momentum, leading to a minor bounce or retracement.
– Head: The second trough (head) is the lowest point in the pattern. It signifies the final attempt of sellers to push the price lower. However, buying pressure becomes stronger, resulting in a more significant bounce or reversal.
– Right Shoulder: The third trough (right shoulder) forms at a similar level to the left shoulder. It represents another failed attempt by sellers to sustain the downtrend. The price then undergoes a bounce, forming a resistance level near the previous peaks.
2. Neckline:
The Neckline is a trendline that connects the high points of the bounces or reversals between the troughs of the pattern. It acts as a resistance level and plays a crucial role in confirming the pattern.
3. Confirmation of the Pattern:
The Inverted Head and Shoulders pattern is considered complete when the price breaks above the Neckline. This breakout should be accompanied by an increase in trading volume, indicating a potential trend reversal.
– Bullish Reversal: The breakout above the Neckline suggests that buying pressure has overwhelmed selling pressure, indicating a shift from a downtrend to an uptrend. Traders often interpret this as a bullish signal to enter long positions or exit short positions.
4. Target:
To estimate the potential price target after the breakout, traders commonly use the pattern’s height. They measure the distance from the bottom of the Head to the Neckline and project it upward from the breakout point. This projection provides an approximate target for the potential upward move.
It’s important to note that not all Inverted Head and Shoulders patterns result in significant reversals, and false signals can occur. Traders often use additional technical indicators or price confirmation to validate the pattern before making trading decisions. Additionally, variations of the Inverted Head and Shoulders pattern, such as complex or extended versions, can also occur, and traders adapt their analysis accordingly.
The Inverted Head and Shoulders pattern can be applied to different timeframes and traded in various markets. Traders often combine it with other technical analysis tools and indicators to increase the probability of successful trades.