Stop-Loss Methods
Stop-loss methods are essential for managing risk in trading. It is important to use it consistently, and wise to employ the effective strategy available.

Stop-loss methods in trading forex are essential for managing risk in trading. It is important to use a stop-loss consistently, and while any stop-loss method is better than none, it is wise to employ the most effective strategy available. Designing a stop-loss that aligns with market conditions and fits your trading plan is ideal, although it can be challenging and requires careful consideration.
One approach is to use market sync stops, which prioritize adjusting the stop based on market conditions. Since it is unpredictable whether the market will be volatile, flat, trending, or experience special circumstances, adapting the stop to these conditions is crucial. The average true range (ATR) is a highly adaptable indicator that can be used to set the stop-loss. By determining the ATR for the intended holding period and setting the stop slightly below the entry point, the trader can account for potential price fluctuations. However, it is important to subtract additional points from the ATR to allow for a buffer, as it is unlikely to enter and exit at the exact high or low points.
While using ATR as a basis for setting stops is logical and dynamic, there are some limitations. One challenge is that the ATR value can represent a significant move within the trader’s timeframe. This poses a problem because the expected gain on a trade should ideally be larger than the stop-loss. It is difficult to achieve this when using a stop that exceeds the expected gain. Therefore, it is necessary to set the stop at a fraction of the ATR, even though this exposes the trader to the risk of random price movements. The purpose of a stop-loss is to limit losses rather than eliminate them entirely.
Another issue arises when the stop determined by ATR conflicts with important chart events, such as support or resistance levels. In such cases, it is advisable to modify the stop to align with these chart events. However, determining which chart events to prioritize and resolving the conflict between ATR-set stops and chart-event stops can be challenging.
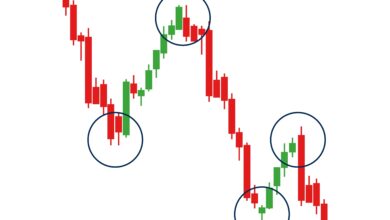
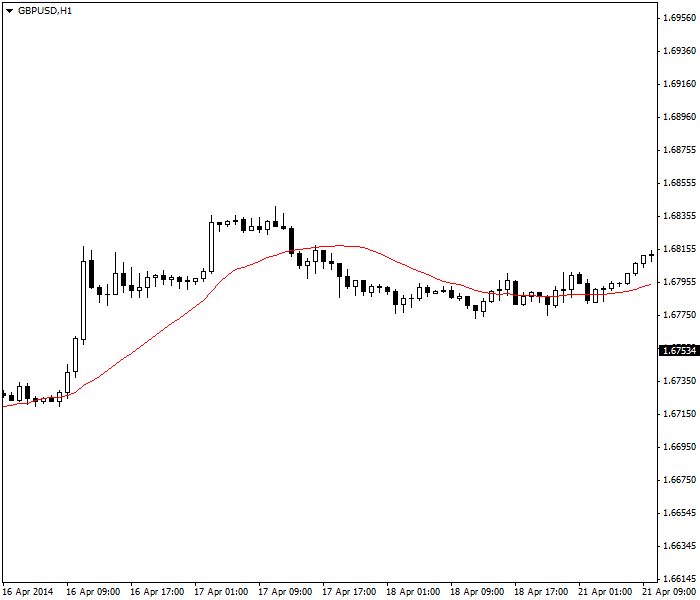
There are various indicators that can be used to set stops, providing more refined options than simply using a fixed limit based on past price movements. Examples include the Parabolic SAR, which attaches the calculation point to the entry rather than extreme market highs or lows. Other indicators like moving average crossovers, MACD, and Bollinger Bands also have built-in stop-loss mechanisms. Additionally, a plain old moving average can be employed as a stop, as demonstrated in the provided chart where crossing the 20-period moving average proved to be the appropriate stop-loss strategy.
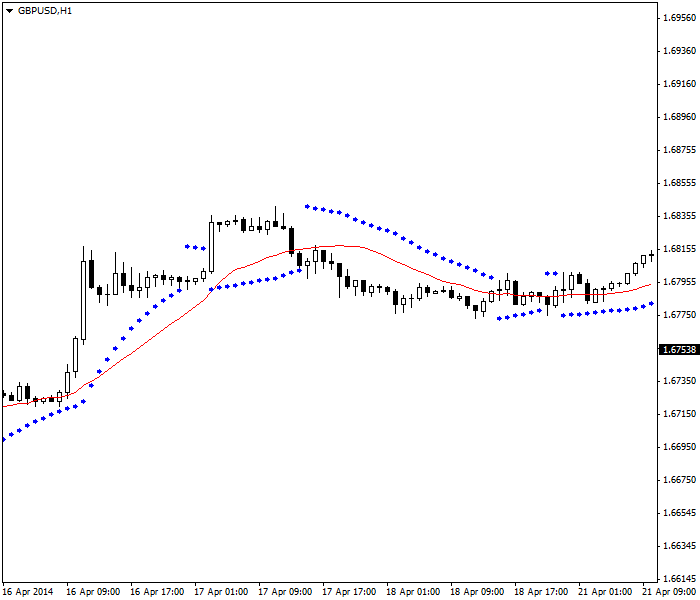
When the Parabolic SAR indicator is added to the chart, it aligns with the crossover signal during the same period. On the right side of the chart, the Parabolic SAR fluctuates between buy and sell signals, while the price bars move around the 20-period moving average. This behavior is typical for trend-following indicators in a price series characterized by range-trading. In such situations, these indicators tend to generate false signals (whipsaws) and lose their effectiveness. It’s worth noting that the charts being referred to have a 60-minute timeframe.
- This highlights two important observations: Utilizing confirmation from multiple indicators is a beneficial strategy, particularly when those indicators employ different mathematical approaches. For instance, incorporating the stochastic oscillator alongside the parabolic SAR and the moving average crossover allows for the identification of the stop signal a day in advance.
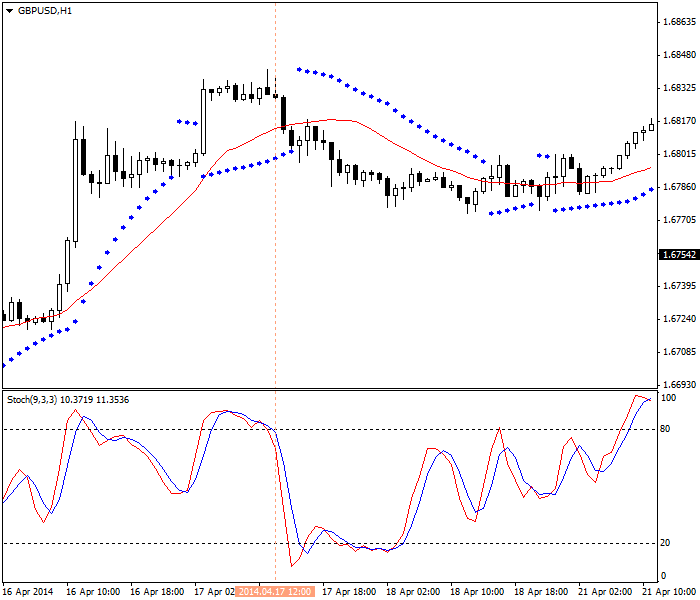
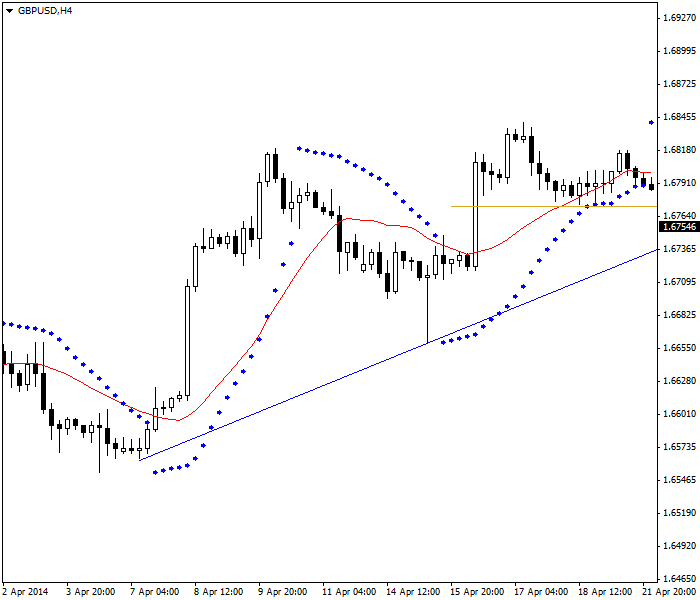
Getting warning about stop-loss earlier with a stochastic oscillator. - Establishing stop-loss levels in a trending market is relatively straightforward compared to doing so in a market characterized by range-bound price movements.When engaging in trading activities within a narrow time frame, such as 1 to 4 hours, it is easy to overlook the importance of gaining a broader perspective. Expanding the timeframe can prove beneficial, as demonstrated in the following image. The screenshot depicts the same chart but in a 240-minute (H4) timeframe. By drawing a line connecting two significant lows, we can identify a support line. While support and resistance levels can be used to determine stop-loss positions, they are not applicable in this specific case. Instead, our focus is on the horizontal gold line intersecting the breakout bar. It is anticipated that prices will not drop below this gold line, and thus far, they have adhered to this expectation.
If you are gradually exiting a multi-lot position, the gold line can serve as an additional stop level. For example, if you have 4 lots, you might stop out one lot when the stochastic oscillator shows a downward trend. Then, when the parabolic SAR and the moving average crossover occur in the next period, you may choose to stop out two more lots. However, you can retain one lot until the gold line is breached.
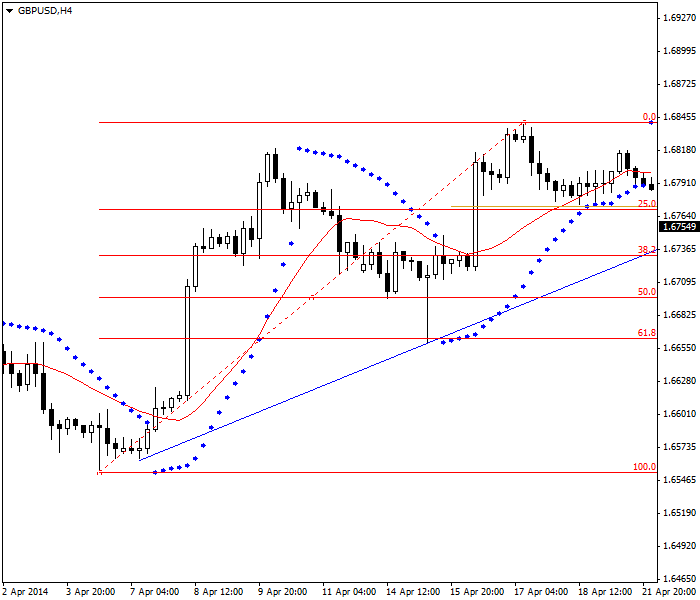
Another indicator that provides valuable perspective is the Fibonacci retracement sequence. While opinions may vary on Fibonacci numbers, many traders rely on them, and it would be unwise not to consider the retracement sequence whenever possible. In the chart below, we observe that the 25% retracement aligns slightly above the midline of the gold breakout bar. It may be prudent to adjust the stop for the remaining lot to allow for a little extra room just below both levels. A break of both levels would serve as a form of confirmation. While it would be helpful to know the frequency with which this currency typically breaks the 25% retracement line and the gold midline, it is not essential. Ultimately, the purpose of a stop is to limit losses, not to speculate on whether this particular instance falls within the 75% of times when the pullback does not exceed a 25% retracement.
Trading Plan Stops
The main objective of setting a stop-loss is to limit the potential loss on a trade to a specific amount of money or a percentage of capital. In simpler terms,
Rule #3: The stop-loss should be determined systematically based on the trader’s capital.
The stop level should be relevant to the trader’s financial situation, rather than solely considering market conditions. In the example mentioned earlier, using the ATR fraction, a stop of 40 points or approximately $400 was calculated. Let’s compare this amount to the total capital. If a trader has $10,000, a $400 loss represents 4% of their capital. The commonly recommended maximum percentage is 2%, so a stop of 40 points exceeds this recommendation. To bring the stop down to 2%, the trader would need to double their capital or reduce their position size.
For a trader starting with only $1,000 in capital, a 40-point stop represents 40% of their capital. After experiencing two consecutive losses (which is common), a trader with low capitalization would be in a difficult situation. In this case, the trader with $1,000 starting capital could consider a 20-point stop. However, it’s important to note that the market can move 20 points in just 3 minutes. Therefore, the stop would be triggered 8 out of 10 times due to random fluctuations alone.
This is a challenging lesson to accept. Many traders refuse to acknowledge it, but the arithmetic clearly indicates the risk of not considering capital when setting stops. Ignoring capital management can lead to a depletion of trading funds. Among beginners, this is the most common and often fatal mistake (aside from not using any stop-loss at all).
The problem is that in order to trade Forex with a realistic expectation of making a profit while using a 2% stop-loss of capital, one needs more than $1,000 or even $10,000 as starting capital. Alternatively, trading smaller contract sizes can be an option. Switching to the shortest possible timeframe can also be effective as it reduces the average distance of the stop. However, this means being less of a trend-follower since trades need to be executed quickly. This is unfortunate because Forex markets often exhibit strong trends, which present profitable opportunities.
Nevertheless, there are some mitigating factors that can be applied. One approach is to backtest various stop levels against recurring scenarios. It may be discovered that a 20-point stop works more than half of the time when specific stop indicators are triggered. Alternatively, even if the indicators only work 50% of the time, adding a third or fourth indicator may increase the success rate. It’s important to keep in mind that backtesting has its limitations since conditions may be similar but never exactly the same.
An important factor in improving the effectiveness of a low stop-loss point count is to trade only when prices are trending. While statisticians have struggled to define when a trend ends, a knowledgeable and observant trader can detect an upcoming change using techniques such as bar-reading, candlestick patterns, momentum, and other methods.
Solutions
Some professionals employ a strategy called “stop exhaustion” hunting. During a pullback, as prices search for a temporary bottom (as shown in the example charts above), there comes a tipping point where the next few bars will indicate whether the pullback is over. It’s important to note that entries are crucial. If a trader can enter at the beginning of a resumption of a move, they have a good entry point and a built-in stop, which is the last lowest low. In the Fibonacci example mentioned earlier, the market has already indicated that the move is stopping just before the 25% retracement and the breakout bar’s midline. If the price starts to rise from this point, it can be assumed that unless negative news surfaces, most traders will place their stops at the previous low. Re-entering the long trade in this currency would likely result in a stop distance much smaller than the 40 points determined by the ATR-based stop. Ideally, it would align more closely with the recommended 2% maximum risk per trade, even with a larger position size.
Some analysts suggest that stop hunting occurs more frequently at round numbers or other specific levels. While it is true that Forex prices often close near round numbers more frequently than random chance would allow (according to research conducted by the US Federal Reserve), it cannot be conclusively verified that round numbers are reversal points more often than expected. It’s worth considering that reversal points tend to be round numbers due to the counting of reversals from the last lowest close. However, it cannot be inferred that any arbitrary round number close will likely serve as a reversal tipping point.
Another significant solution is the use of trailing stops. A trailing stop is tightened progressively to the current price as it moves in the profitable direction of the trader’s position. The parabolic SAR is an example of a classic trailing stop.
For instance, if the initial stop is set at 40 points and the Trading Plan Stops – Paraphrased:
The primary purpose of implementing a stop-loss is to restrict potential losses on a trade by specifying a fixed amount or percentage of capital. Essentially, the stop-loss should be proportionate to the trader’s trading capital, as outlined in Rule #3.
It’s crucial to consider the trader’s financial situation rather than solely focusing on market conditions when determining the appropriate stop level. For example, if the ATR fraction method suggests a 40-point stop, equivalent to approximately $400, let’s compare this to the trader’s total capital. If the trader has $10,000, a $400 loss amounts to 4% of their capital. The general recommendation is to limit the stop to 2% of capital, so a 40-point stop exceeds this guideline. To align with the 2% risk, the trader would need to either double their capital or trade smaller positions.
Conversely, if a trader has a starting capital of only $1,000, a 40-point stop represents 40% of their capital. In this scenario, after experiencing two consecutive losses (a common occurrence), a trader with limited capital would face significant challenges. To address this, the trader with $1,000 could consider setting a 20-point stop. However, it’s important to note that the market can move 20 points within a mere 3 minutes. Consequently, the stop would be triggered 8 out of 10 times due to random fluctuations alone.
Accepting this reality can be difficult for many traders. However, disregarding the importance of capital management when placing stops can lead to a depletion of trading funds. Among beginners, this is the most widespread and often fatal mistake, second only to not utilizing any stop-loss at all.
The issue is that to engage in Forex trading with a realistic expectation of profitability and using a 2% stop-loss relative to capital, more than $1,000 or even $10,000 in starting capital is typically required. Alternatively, trading smaller contracts can be an option. Another approach is to switch to the shortest possible timeframe to reduce the average stop distance. However, this limits the ability to be a trend follower since positions must be closed quickly. This is unfortunate since Forex markets often exhibit strong trends, which present lucrative opportunities.
Nonetheless, there are some potential solutions to mitigate these challenges. One strategy is to backtest different stop levels against recurring market scenarios. It may be discovered that a 20-point stop is successful more than 50% of the time when specific stop indicators are triggered. Even if the indicators only work 50% of the time, incorporating a third or fourth indicator may increase the success rate. It’s important to remember that backtesting has limitations since conditions may be similar but never exactly the same.
An important factor in enhancing the effectiveness of a low stop-loss count is to only trade when prices are exhibiting a clear trend. While statisticians have struggled to precisely define when a trend ends, experienced traders can detect an upcoming change by employing techniques such as bar-reading, candlestick patterns, momentum, and other methods.
Potential solutions include employing the strategy of “stop exhaustion” hunting. During a pullback, as prices search for a temporary bottom, there comes a tipping point where a few subsequent bars indicate whether the pullback is over. The entry point is crucial in this approach. If a trader manages to enter at the beginning of the resumption of a move, they have a favorable entry and a built-in stop, which is the previous lowest low. For instance, if the market indicates that the move is halting just before the 25% retracement and the breakout bar’s midline, assuming no negative news emerges, entering a long trade at this point would likely result in a much smaller stop distance compared to the 40 points determined by the ATR-based stop. Ideally, it would align more closely with the recommended 2% maximum risk per trade, even with a larger position size.
Some analysts suggest that stop hunting occurs more frequently at round numbers or specific levels. While it is true that Forex prices often close near round numbers more frequently than random chance would allow (as per research conducted by the US Federal Reserve), it cannot be definitively established that round numbers serve as reversal points more often than expected. It’s worth considering that reversal points tend to align with round numbers due to the counting of reversals from the previous lowest close. However, it cannot be inferred that any arbitrary round number close will likely serve as a reversal tipping point.
Another significant solution is the utilization of trailing stops. A trailing stop is adjusted progressively closer to the current price as it moves in the trader’s favor. The parabolic SAR is a well-known example of a trailing stop.
For instance, if the initial stop is set at 40 points and the price moves up by 20 points, the trader can tighten the stop to 30 points to protect the gained profit. If the price increases by another 20 points, the stop can be further tightened to 20 points. At this point