Technical analysis tools

Let’s delve into each of the technical analysis tools used in forex trading and explore how they can be applied to analyze price movements and make informed trading decisions:
1. Trend Lines:
Trend lines are drawn on price charts to visualize the direction of the market trend. An uptrend is formed by connecting a series of higher lows, while a downtrend is created by connecting lower highs. Trend lines provide valuable information about the strength and stability of a trend. Traders use trend lines to identify potential entry and exit points based on the continuation or reversal of the trend. Breakouts above or below a trend line can signal potential trading opportunities.
2. Support and Resistance Levels:
Support and resistance levels are price levels on a chart where the buying (support) or selling (resistance) pressure is significant. These levels are determined by historical price points where the market has shown a tendency to reverse or stall. Support levels indicate areas where buyers are likely to enter the market, causing prices to bounce higher. Resistance levels, on the other hand, suggest areas where sellers may come in, causing prices to retreat. Traders use support and resistance levels to identify potential price reversals or breakout opportunities. A breakout above a resistance level or a breakdown below a support level can indicate a significant move in price.
3. Moving Averages:
Moving averages (MA) are calculated by averaging the prices over a specified period. They help smooth out price fluctuations and provide a clearer picture of the underlying trend. Traders use different types of moving averages, such as simple moving averages (SMA) and exponential moving averages (EMA). Moving averages can be used in various ways. For instance, when a shorter-term moving average crosses above a longer-term moving average, it may signal a potential uptrend, and vice versa. Moving averages can also act as dynamic support or resistance levels, where prices tend to bounce off or break through.
4. Oscillators:
Oscillators are technical indicators that fluctuate within a specific range, providing insights into overbought or oversold conditions in the market. Common oscillators include the Relative Strength Index (RSI), Stochastic Oscillator, and Moving Average Convergence Divergence (MACD). Oscillators measure the momentum or speed of price movements. Traders use these indicators to identify potential trend reversals, divergences (when the price and oscillator move in opposite directions), and overbought or oversold conditions. When an oscillator reaches extreme levels, it may suggest a potential reversal or correction in price.
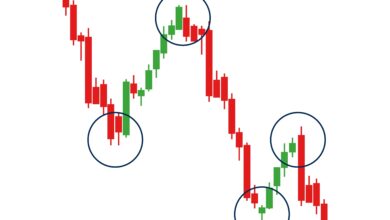
5. Chart Patterns:
Chart patterns are formed by the price movements on a chart and offer insights into potential future price movements. Common chart patterns include triangles, head and shoulders, double tops and bottoms, and flags. Traders analyze these patterns to identify trend continuation or reversal scenarios and to determine entry and exit points. For example, a breakout from a bullish triangle pattern may indicate a continuation of an uptrend, while a breakdown from a head and shoulders pattern may signal a potential trend reversal.
By utilizing these technical analysis tools, traders aim to gain insights into price movements, identify patterns, and make informed trading decisions. It’s important to note that technical analysis is based on historical price data and patterns, and it assumes that past price behavior will repeat in the future. However, traders should always consider other factors such as market conditions, news events, and risk management before making trading decisions solely based on technical analysis.