
Triple Top/Bottom
Certainly! The Triple Top and Triple Bottom are chart patterns commonly used in technical analysis by traders to identify potential trend reversals. These patterns occur after an extended uptrend or downtrend and can provide valuable insights into market sentiment.
Triple Top
The triple top chart pattern is a technical analysis charting pattern used to identify potential reversal in an instrument’s price. It is characterized by three near-equal highs followed by a break below the support level. The triple top pattern is considered to be one of the most reliable reversal patterns in technical analysis, as it requires three distinct price peaks before the trend reverses. The pattern usually starts with an upward trend that reaches three distinct prices. After the third peak, the price breaks the support level, which indicates a possible trend reversal. The trend reversal is confirmed when the price breaks the support level again and falls below the previous low. The triple top pattern is an important indicator of a potential trend reversal and can help traders determine when to enter and exit positions. It is important to remember that the triple top pattern is not a sure-fire signal of a trend reversal and should be used with other indicators.
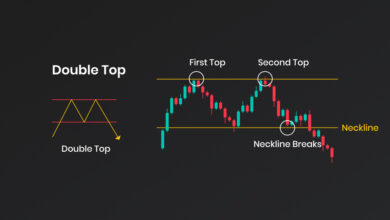
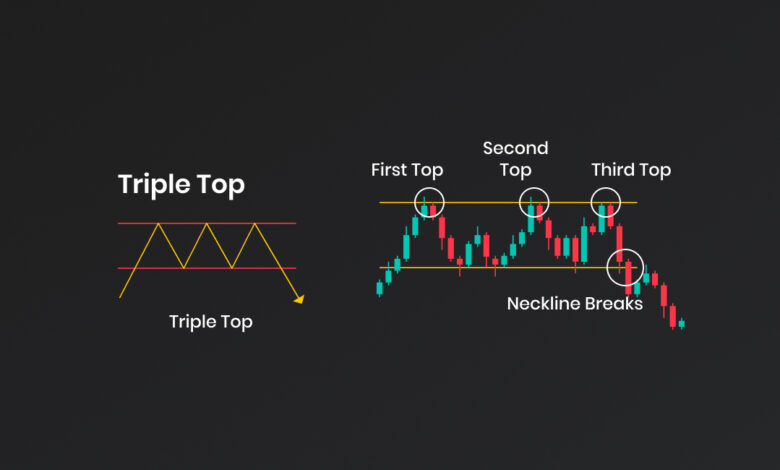
The Triple Top pattern is a bearish reversal pattern that forms after an extended uptrend. It consists of three peaks at approximately the same price level, separated by two minor pullbacks. The pattern signifies a struggle between buyers and sellers, indicating that the bullish momentum is weakening and a potential trend reversal is imminent.
Here’s how the Triple Top pattern typically forms:
– First Peak: The price reaches a high point, followed by a minor pullback as profit-taking occurs. This pullback often finds support near a previous resistance level.
– Second Peak: The price rallies again, but fails to surpass the previous high. It encounters selling pressure, resulting in a second pullback.
– Third Peak: The price makes another attempt to rally, but fails to break above the previous highs. Sellers take control, causing a significant decline in price.
The pattern is considered complete when the price breaks below the support level formed by the troughs between the three peaks. This breakdown confirms the reversal and signals potential further downside movement. Traders often interpret this as a bearish signal to enter short positions or exit long positions.
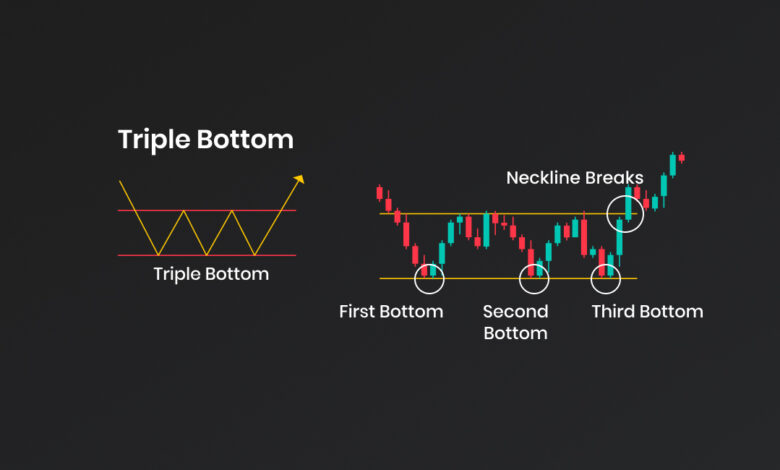
Triple Bottom
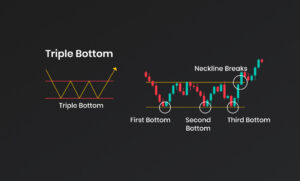
A triple bottom chart pattern is a technical analysis indicator which is formed when an instrument’s price records three consecutive lows at approximately the same level. The triple bottom chart pattern indicates that sellers have tried to push the price lower but have been met with strong buying pressure that stops the price from falling further. This pattern, if confirmed, can signal potential reversal in the asset’s price and an increase in the overall uptrend.
The Triple Bottom pattern is a bullish reversal pattern that forms after an extended downtrend. It consists of three bottoms at approximately the same price level, separated by two minor bounces. The pattern suggests a shift in market sentiment from bearish to bullish, indicating a potential trend reversal.
Here’s how the Triple Bottom pattern typically forms:
– First Bottom: The price reaches a low point, followed by a minor bounce as bargain hunters enter the market. This bounce often encounters resistance near a previous support level.
– Second Bottom: The price declines again, but fails to break below the previous low. Buyers step in, resulting in a second bounce.
– Third Bottom: The price makes another downward move, but finds support near the previous lows. Buyers become more dominant, leading to a significant upward move.
The pattern is considered complete when the price breaks above the resistance level formed by the peaks between the three bottoms. This breakout confirms the reversal and signals potential further upside movement. Traders often interpret this as a bullish signal to enter long positions or exit short positions.
It’s important to note that while Triple Top and Triple Bottom patterns can indicate potential reversals, they are not foolproof and can sometimes result in false signals. Traders often use additional technical indicators or price confirmation to validate these patterns before making trading decisions.